Day 7. Same stack as yesterday. Same framework. Not the most original idea either.
After Day 6 proved I could build with Go and Bubble Tea despite never having touched either, I wanted to test something else: what happens when you point the AI at an existing tool and ask it to build a wrapper? In this case, git. I have too many repos and zero idea which ones have uncommitted changes.
The Prompt#
“Build a TUI app in Go that scans a directory tree for git repos and shows their status in a terminal dashboard. Color-coded: green for clean, yellow for dirty, blue for ahead/behind. Let me fetch, pull, and open a shell in any repo. Use Bubble Tea for the UI.”
How It Was Built#
The interesting part of this build isn’t the UI or the framework. It’s how the AI interfaced with git. The whole app is essentially a wrapper: it shells out to git for every piece of information it displays. Branch names, commit hashes, ahead/behind counts, stash lists, dirty file tracking. It doesn’t use a Go git library. It runs the same commands you’d type by hand and parses the output.
The AI broke the work down into packages that map to concerns: a scanner that walks directory trees looking for .git folders, a git package that wraps CLI commands, a config system using YAML, and a TUI layer built on Charm’s Bubble Tea. The scanner skips node_modules, vendor, and hidden directories. The git package handles branch, status, log, rev-list, stash list, and describe. The UI has clean separation between list view, detail view, status bar, help overlay, and styles.
It even came with a Makefile for cross-platform builds (darwin/linux, amd64/arm64) and an install script that auto-detects your OS and architecture.
What I Got#
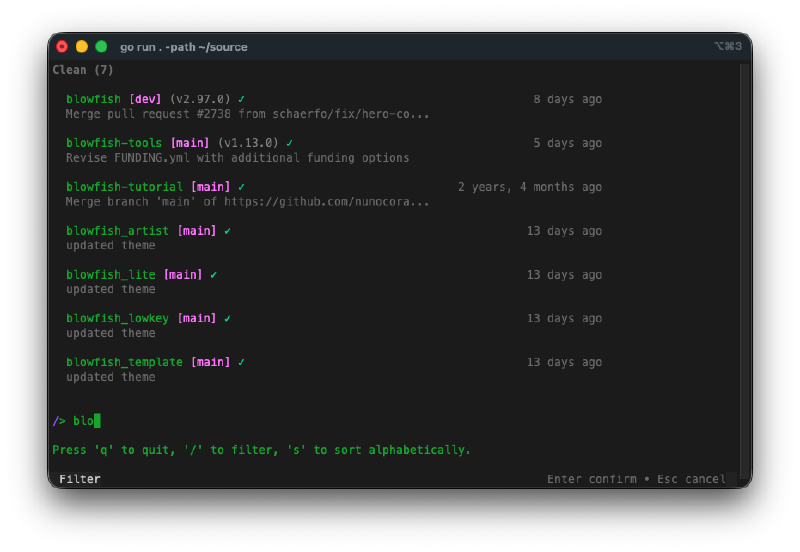
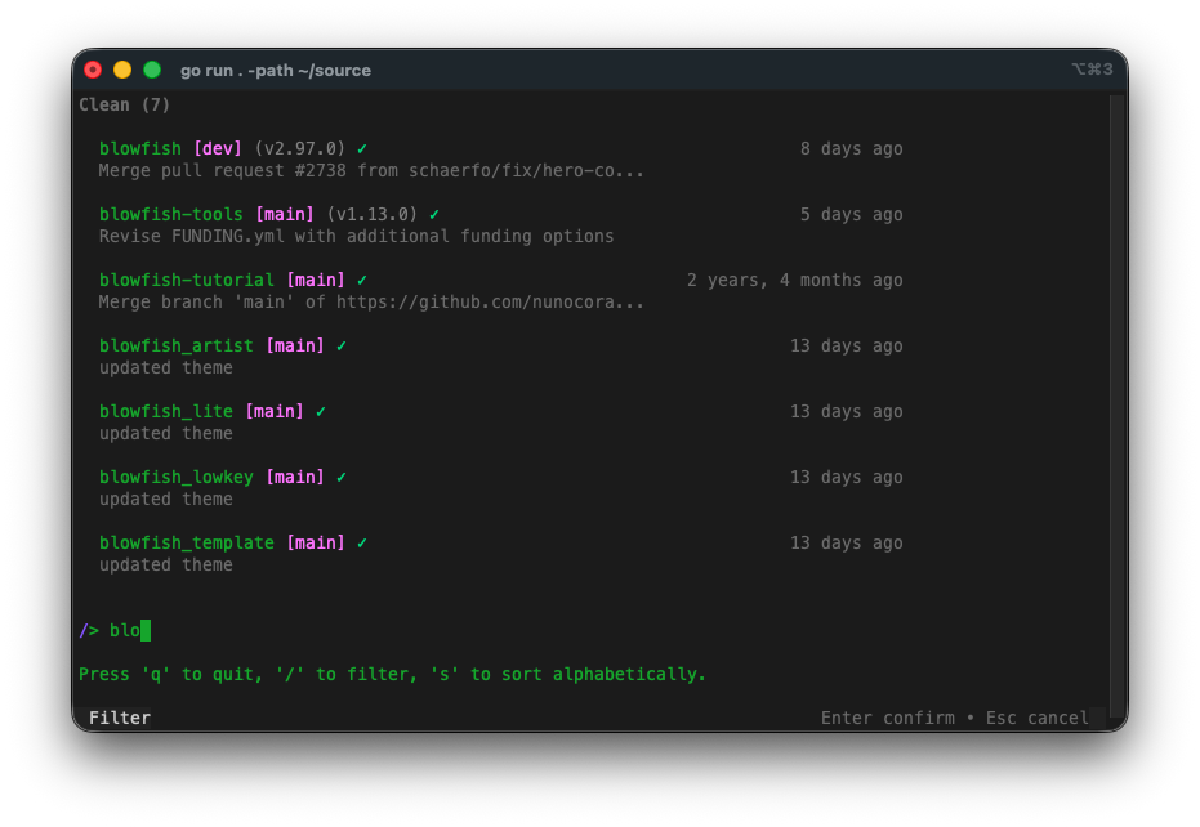
It groups repos by status. Dirty repos with uncommitted changes show up first (yellow dot), then repos that need syncing with remote (ahead/behind counts in blue), then clean repos (green checkmark). At a glance I can see which repos need attention. Press s to toggle between grouped and alphabetical views.
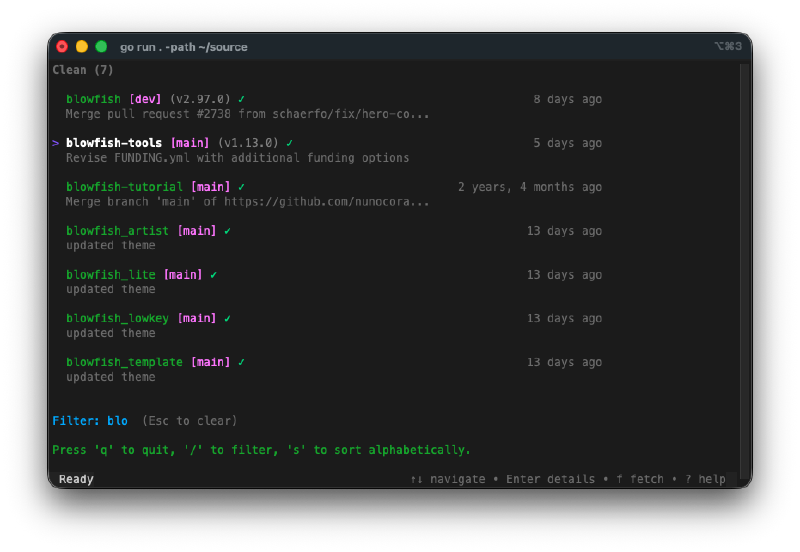
Each repo shows a lot of info on two lines. Name, branch in pink brackets, latest tag in parentheses, clean/dirty indicator, ahead/behind arrows, relative commit time on the right, and the last commit message below. It packs a surprising amount of context into a small space.
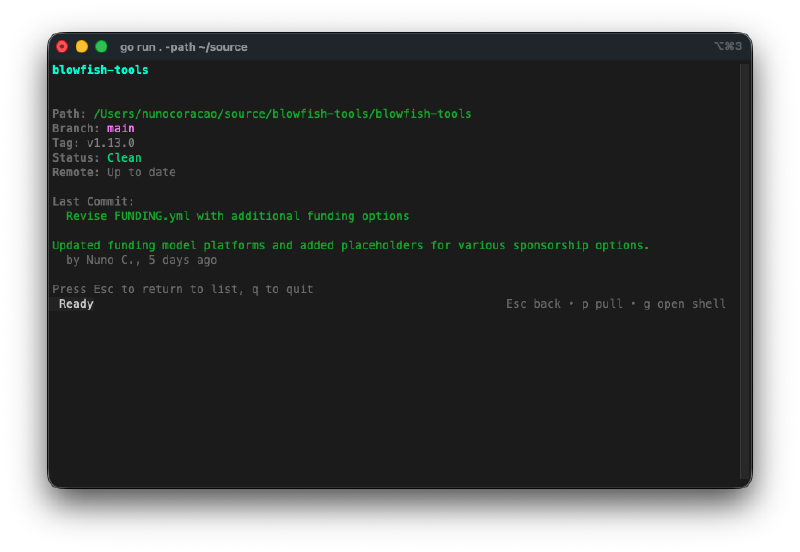
The detail view is genuinely useful. Hit Enter on any repo and you get the full picture: path, branch, tag, status, remote sync state, full commit message with author, list of changed files if dirty, and stash count. From here you can pull, or press g to drop into a shell right in that repo’s directory.
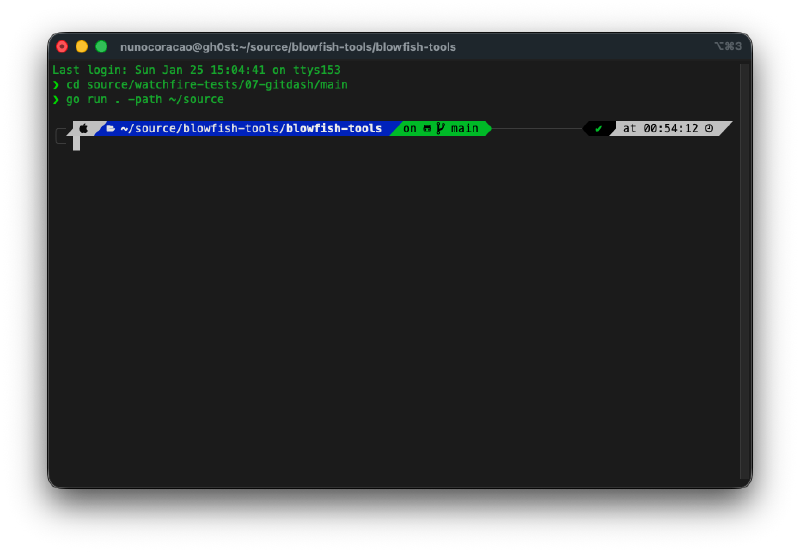
The shell integration works. Press g and it spawns your shell (reads $SHELL) in the repo directory. Do your thing, exit, and you’re back in GitDash. When you come back, it refreshes the repo status automatically.
It has search/filter. Press / and start typing to filter repos by name in real-time. Useful when you’re scanning a directory with dozens of projects.
YAML config file. Set your watch paths in ~/.config/gitdash/config.yaml so you don’t have to pass -path every time. Configure multiple directories, max scan depth, and whether to show hidden folders.
The Bug Reports#
Nothing major on this one. The TUI came together cleanly. The only thing I noticed was that on very large directory trees, the initial scan takes a moment, but it shows a “Scanning for repositories…” message so you know it’s working.
The Numbers#
- 11 Go source files across 5 packages (main, config, git, scanner, ui)
- ~1,900 lines of Go
- 1 test file for the scanner
- Cross-platform builds for macOS and Linux (amd64/arm64)
- Install script with auto-detection of OS and architecture
- Total hands-on time: maybe 20 minutes of testing and tweaking the prompt
Try It#
Install it with:
go install github.com/nunocoracao/Vibe30-day07-gitdash@latestOr the one-liner:
curl -fsSL https://raw.githubusercontent.com/nunocoracao/Vibe30-day07-gitdash/main/scripts/install.sh | bashThen just run gitdash in any directory that contains git repos.
Day 7 Verdict#
Let me be honest: this is not a creative project. A git status dashboard is not a novel idea. Lazygit and tig already exist and do it better. And it’s the same Go + Bubble Tea stack I used yesterday, so there’s no “unfamiliar tech” story to tell either.
But the build revealed something worth noting. The AI didn’t need to understand git’s internals. It just wrapped the CLI. Every piece of data in this dashboard comes from running a git command and parsing the text output. git status --porcelain for dirty files. git rev-list --count for ahead/behind. git stash list for stash counts. It treated git as a black box with a text interface, which is exactly how most developers treat it too.
That’s the interesting pattern from today. You can point AI at any CLI tool with structured output and get a wrapper UI built around it. Git, Docker, kubectl, whatever. The AI doesn’t need to understand the system’s internals any more than you do. It just needs to know what commands to run and how to parse what comes back.
The project itself is fine. It works, the grouping by status is useful at a glance, the detail view packs a lot of info. But I’m not going to pretend this is something I’ll use daily when I can just run git status in each repo. The value here was seeing the pattern, not the specific tool.
This is day 7 of 30 Days of Vibe Coding. Follow along as I ship 30 projects in 30 days using AI-assisted coding.